What Analytics shows
Training completion, task flow, performance and recognition reports, and who can see which.
Analytics answers questions about how your organization is doing: who has finished their training, how work is moving across task boards, where performance reviews are up to, and whether recognition is reaching everyone.
Click Analytics in the sidebar. Choose a tab at the top, and click Refresh to load the latest numbers. On most tabs you can pick a time range, such as the last 30 days or all time.
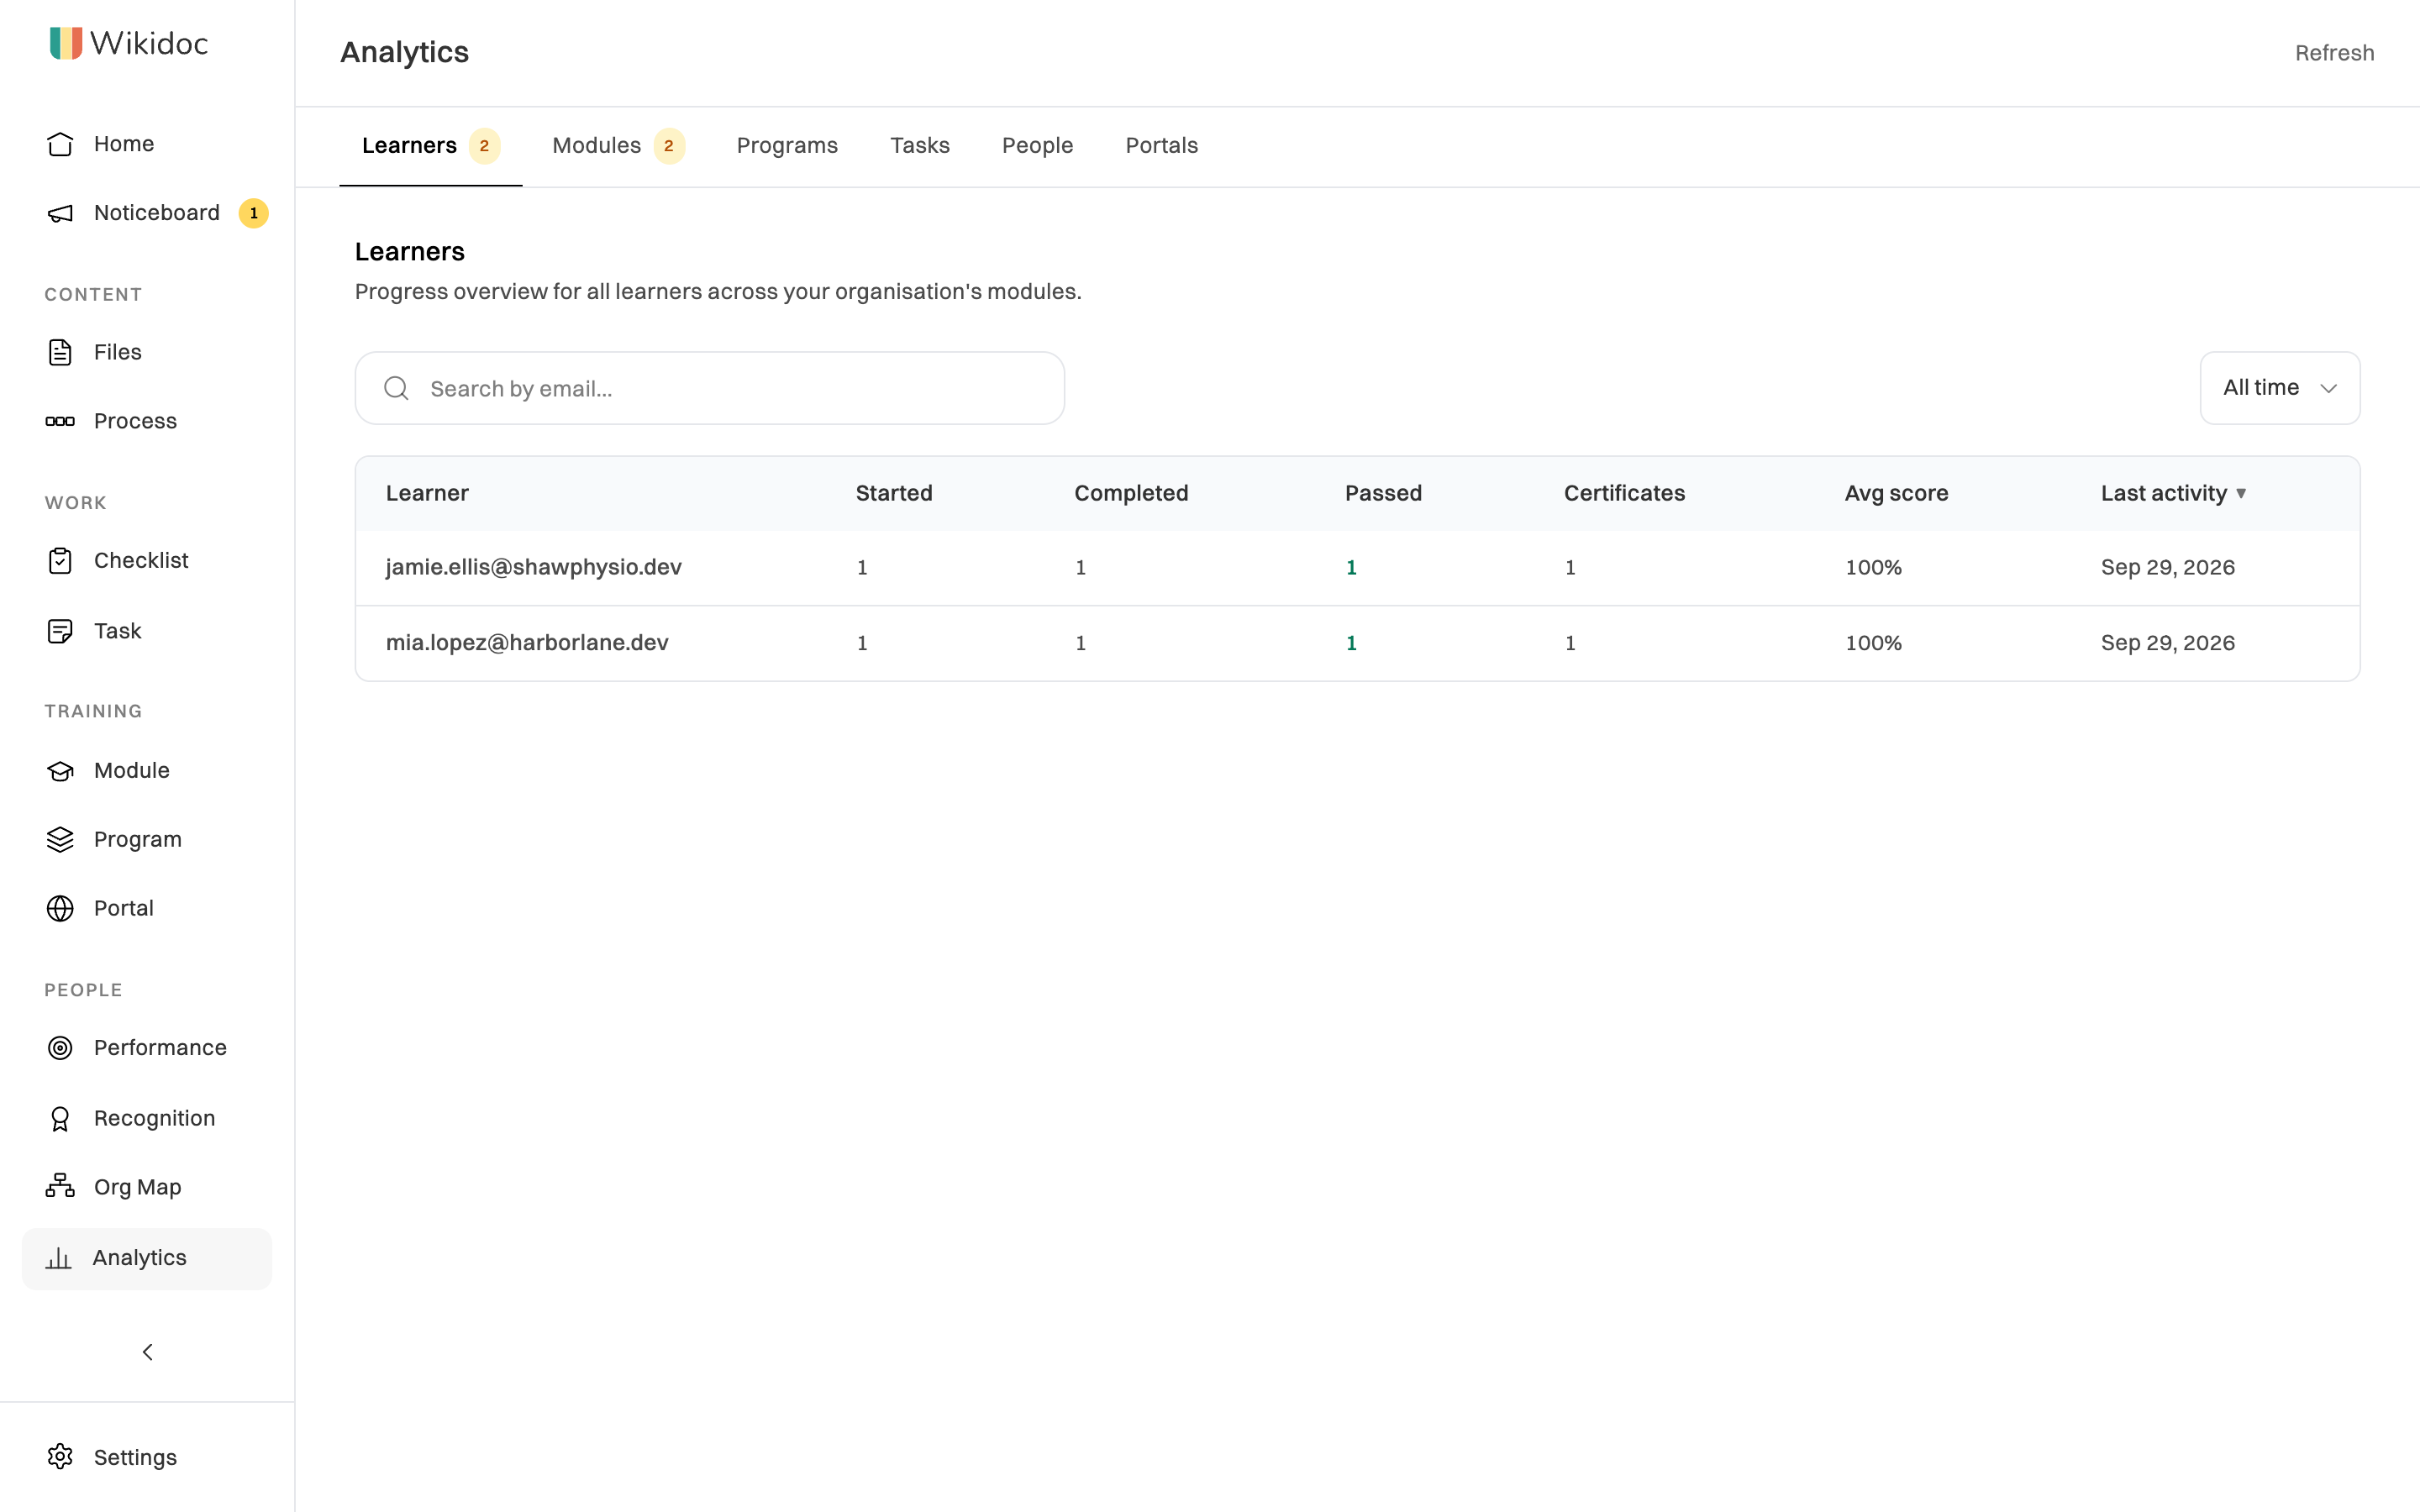
Learners
Section titled “Learners”Every person who has started a training module: how many modules they’ve started, completed and passed, the certificates they’ve earned, their average score and when they were last active. Search by email to find someone.
Modules
Section titled “Modules”Every active module: how many people started, completed and passed it, the completion and pass rates, the average score and time, and certificates issued. Click a module to see each person’s result and to export it. See Export analytics.
Managers see Learners and Modules for the people who report to them directly, as set in Reports to on each person’s profile. A header chip, Your team, says so.
Programs
Section titled “Programs”Pick a program to see how many people are enrolled, how many have finished, how long it takes them, and each section’s completion rate. Enrolled Members lists each person’s progress and how they were enrolled. Admins only.
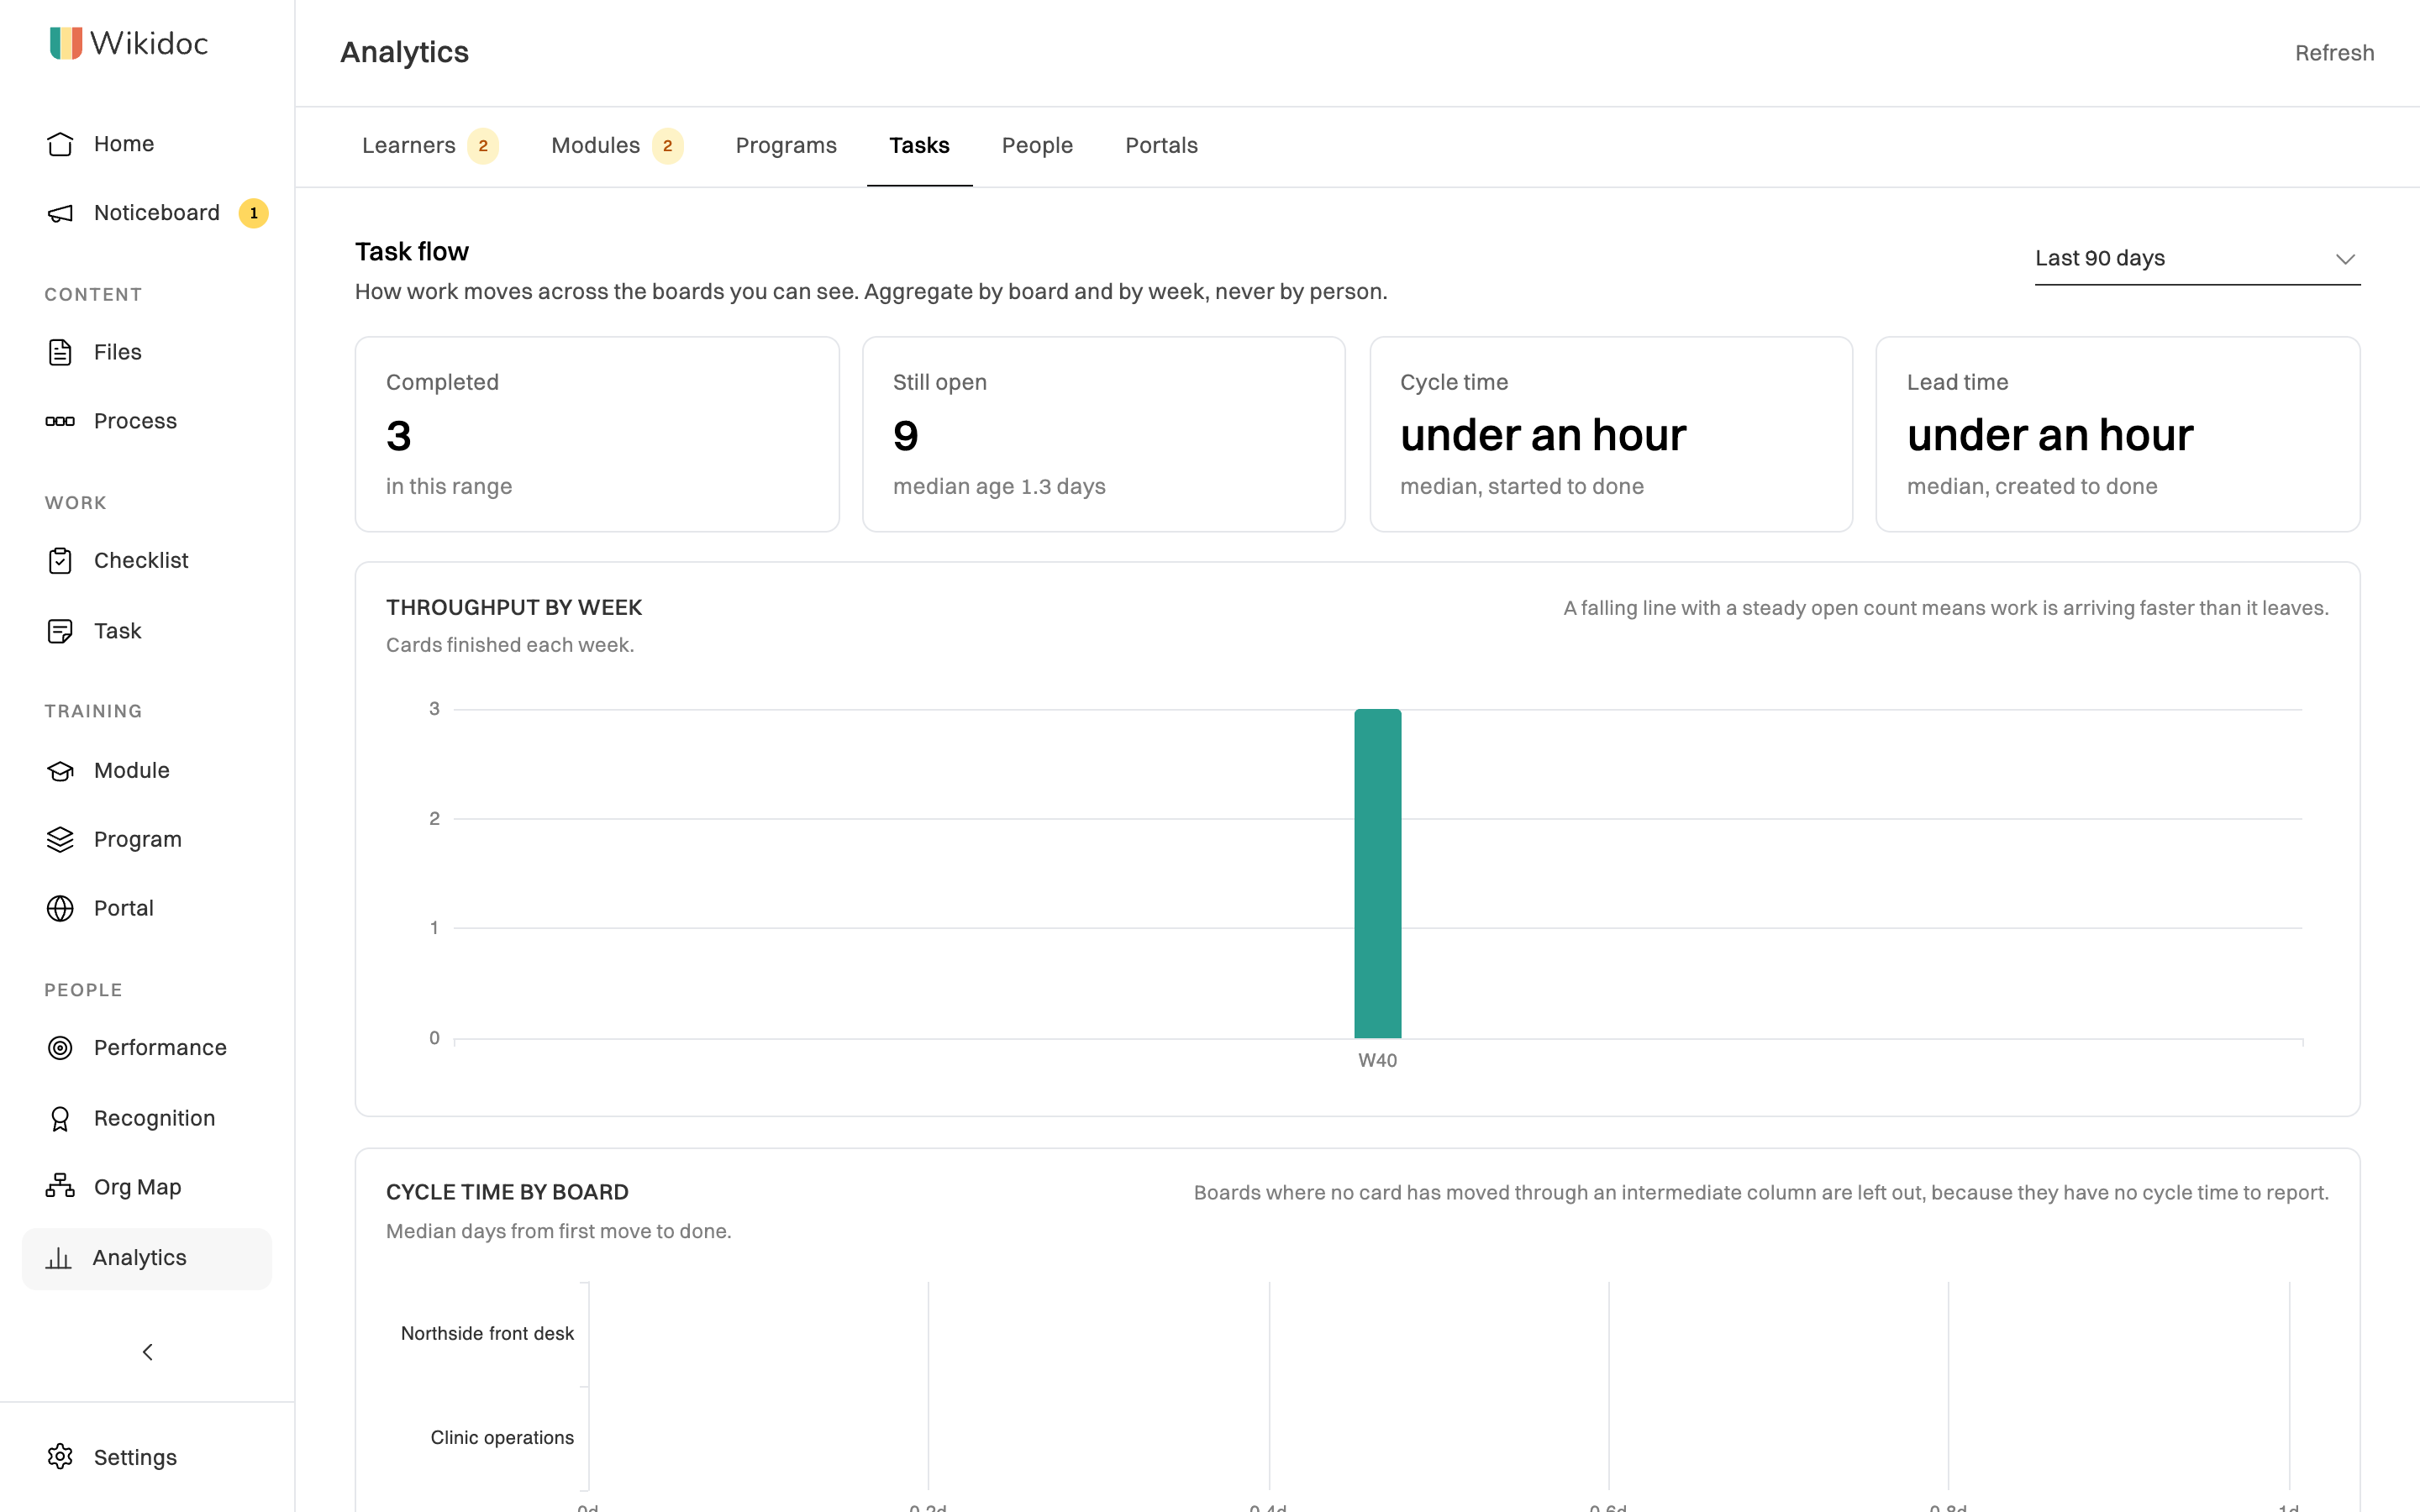
How work moves across the task boards you can open: cards finished and still open, how long cards take from first move to done (Cycle time) and from being created to done (Lead time), cards finished each week, and cycle time by board.
It counts by board and by week, never by person, so it shows how the work flows, not who’s fast or slow.
People
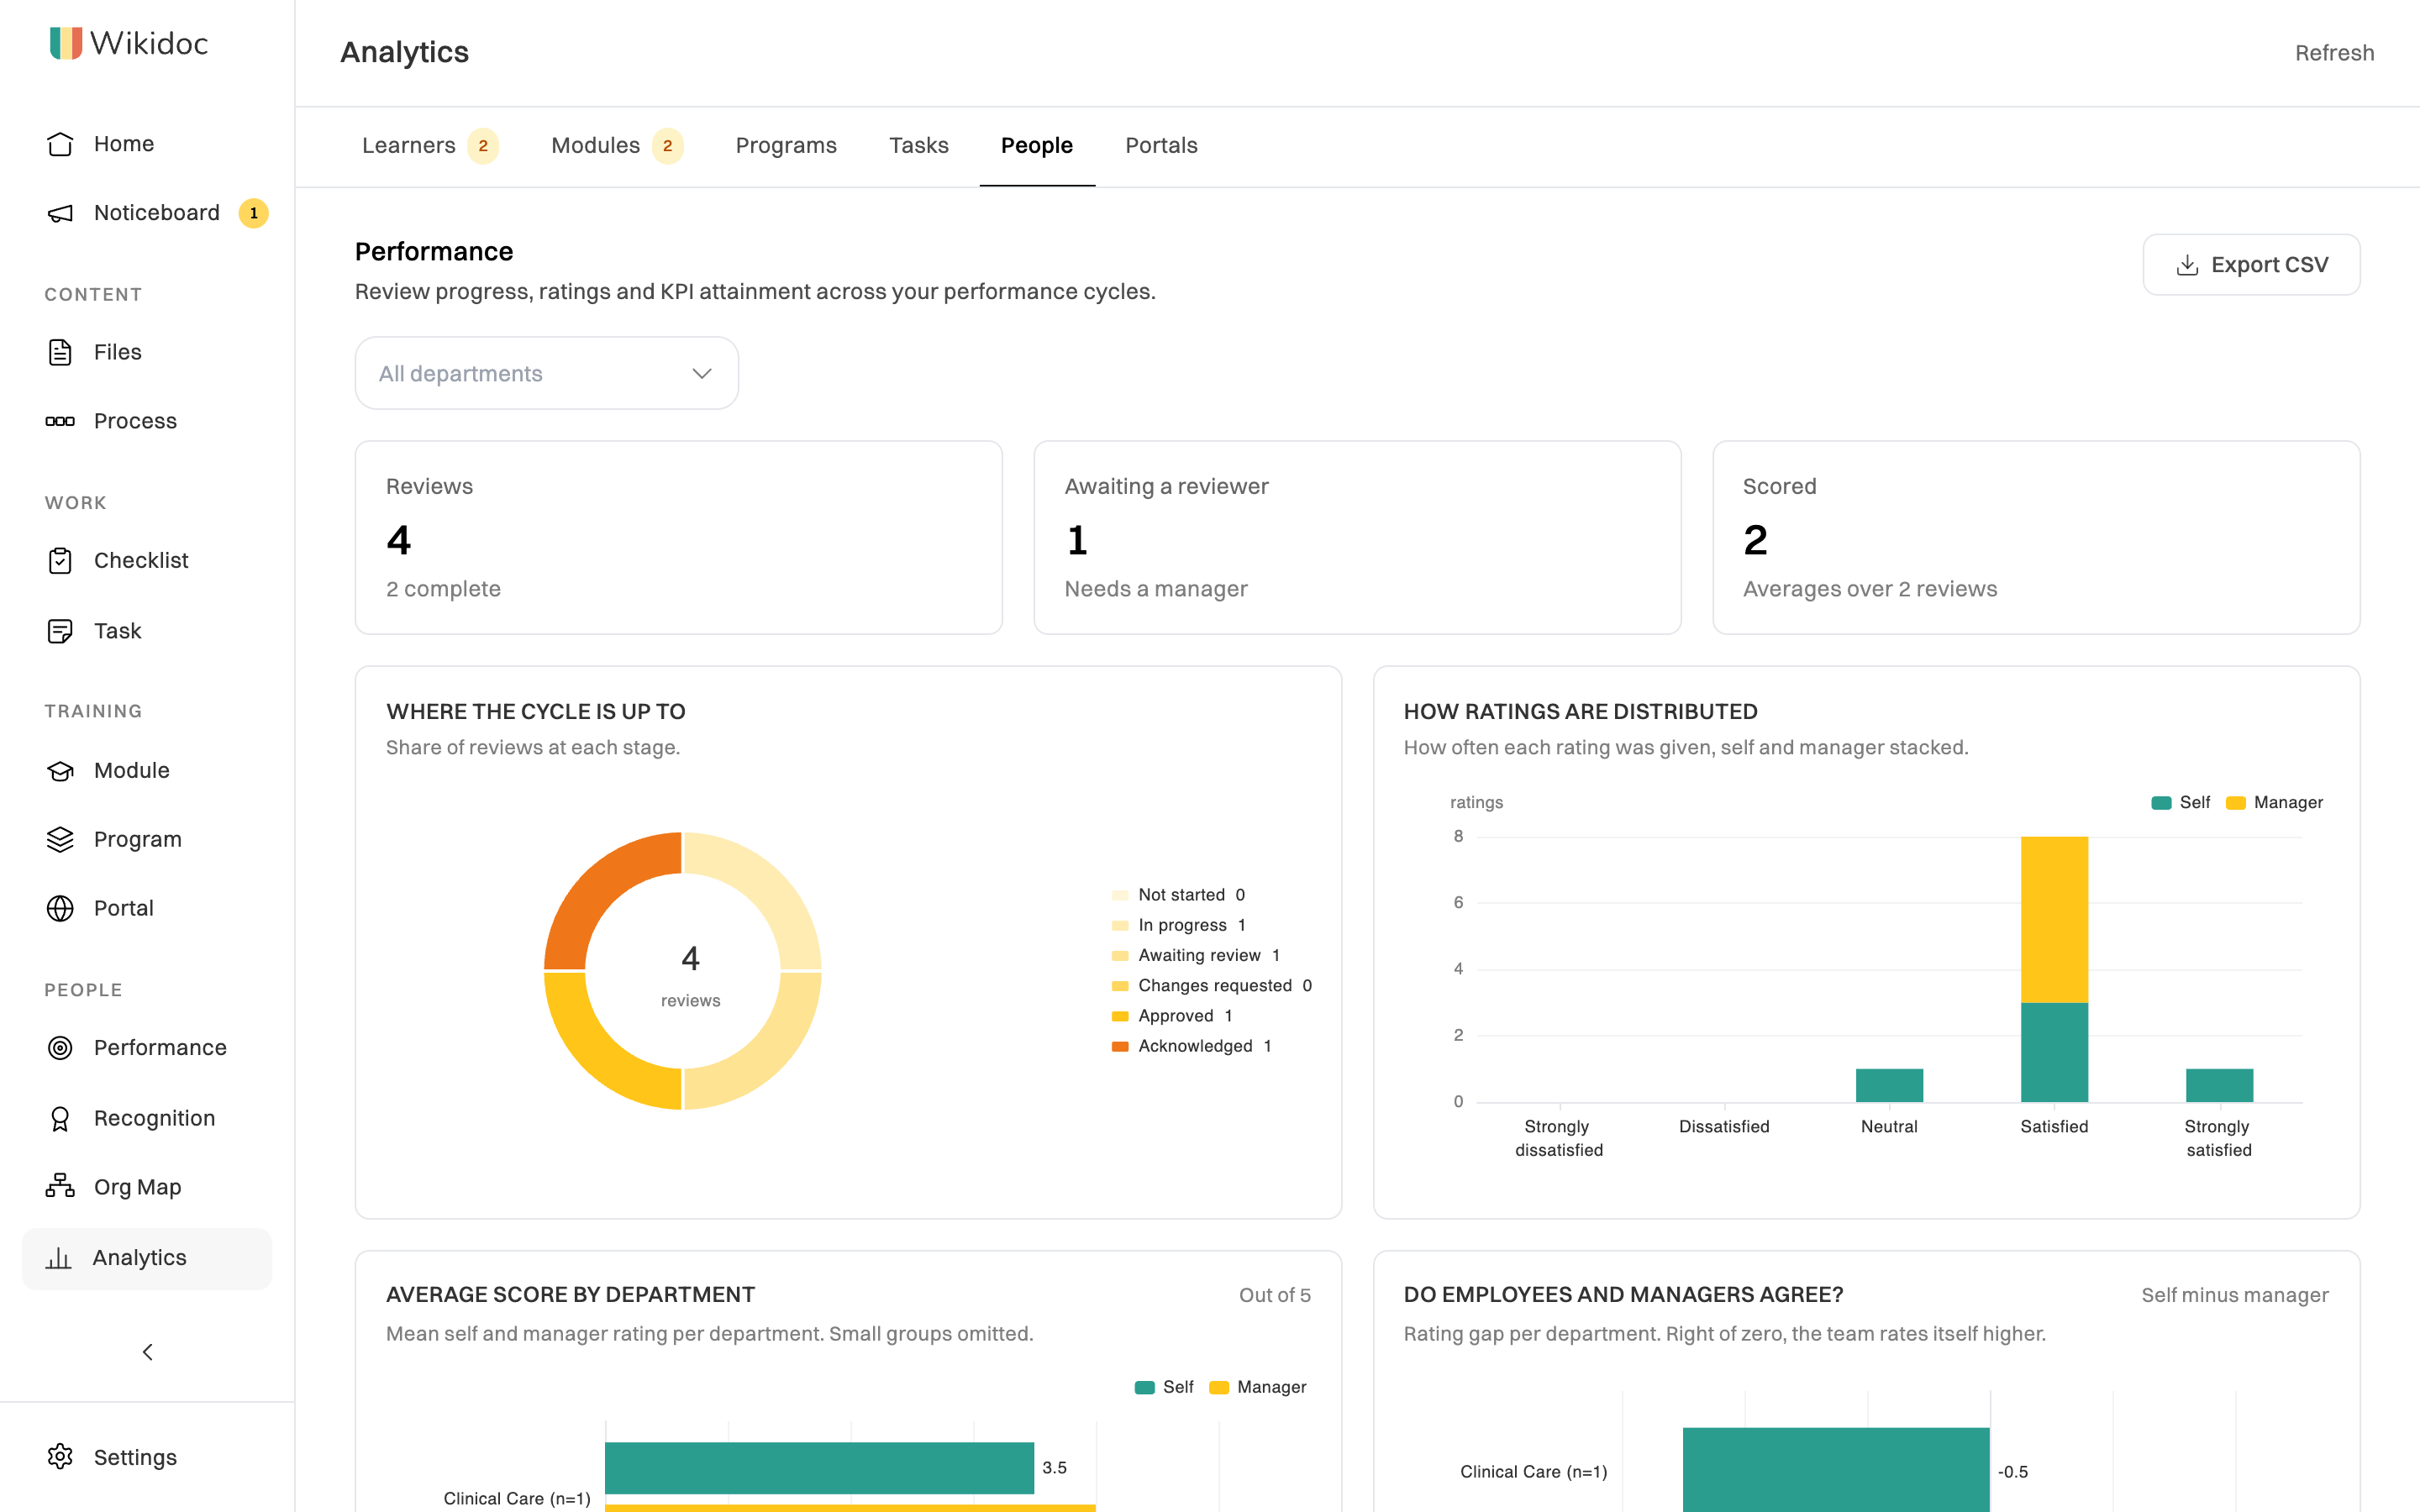
Section titled “People”Two reports on people, each shown only to those allowed to see it:
- Performance: where the current review cycle is up to, how ratings are spread, average scores by department, whether people and their reviewers agree, how scores change from cycle to cycle, KPIs against their targets, reviews that need attention, and how each reviewer rates. See Performance reviews.
- Recognition: how many recognitions are posted and by how many people, how evenly they’re spread across departments, and who hasn’t been recognized. See Recognition, points and awards.
Managers see these for the people below them in the reporting line and in the departments they manage.
To keep individual ratings private, a Manager doesn’t see figures for a group too small to hide who’s in it: a department of two, for example, may not get its own average. For recognition, Admins set that size under Smallest group shown in analytics in the recognition settings.
Portals
Section titled “Portals”Visitors to your client portals: views, sessions, how many clicked through to a module, the devices they used and where they came from. Pick a portal to see its guests’ progress through the training in it. Admins only. See Publish a portal and track activity.